
Economic Development Update Series Part 3: Retail & Sales Activity
On March 14, 2016 Business Development staff presented an Economic Development Update to the City Council, providing an overview of recent economic activity and trends, as well as the impact of ongoing and future developments in San Leandro. The update looked at how economic factors have changed, and in most cases improved, since the depths of the recession in 2010. This is the last in a series of three posts designed to provide a snapshot of San Leandro’s current economic status. Click on the images to see enlarged versions.
Part 3: Retail & Sales Activity
This post examines sales activity in San Leandro over time. Increased demand for goods and services can have a positive impact on the economy, increasing the number of jobs to produce and sell such goods. Taxes from sales activities are used for local services, such as public safety, libraries and parks, as well as infrastructure and transportation improvements.
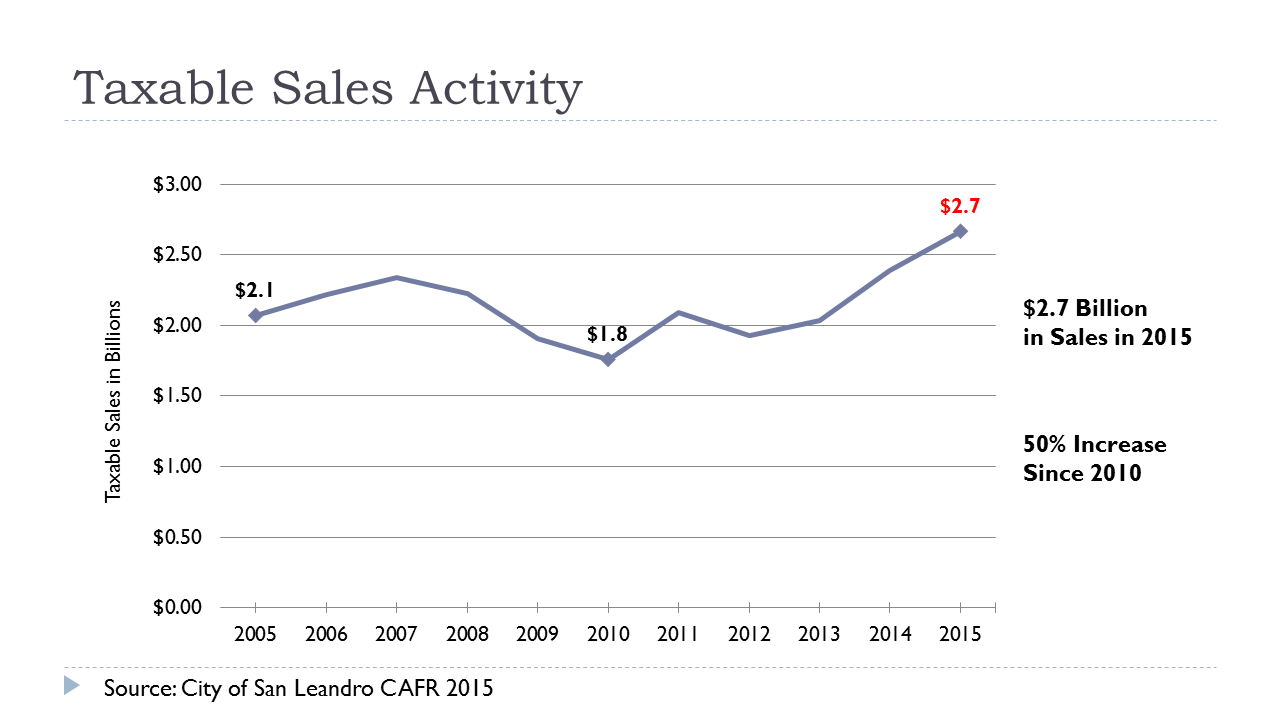
- Sales activity in the City has increased 50% since 2010, up from $1.8 to $2.7 billion.
- Sales in San Leandro are outperforming other areas.
- Sales increased by 11.4% in the past year as compared to 4% increases in the State and Alameda County overall.
- Note: Sales activity refers to the total amount of sales that businesses complete, rather than the amount of sales tax that local governments receive.

- San Leandro has a high sales tax per capita of $268 dollars per resident, more than double the state average. This suggests that a substantial amount of sales activity in San Leandro is generated by residents of other communities that come here to shop.
- Sales tax per capita measures the amount of sales tax activity as compared to the number of residents (total sales/number of residents).
- Sales in San Leandro are spread relatively evenly across a number of sectors.
- The highest levels of sales are in General Retail, Transportation (autos), and Business to Business (wholesale, technical goods, etc.).
- This diverse sales tax base helps the local economy to withstand changes in the market.
- San Leandro offers a wide range of goods and services to its residents, with local businesses meeting the shopping needs of residents, as well as those living in surrounding communities.
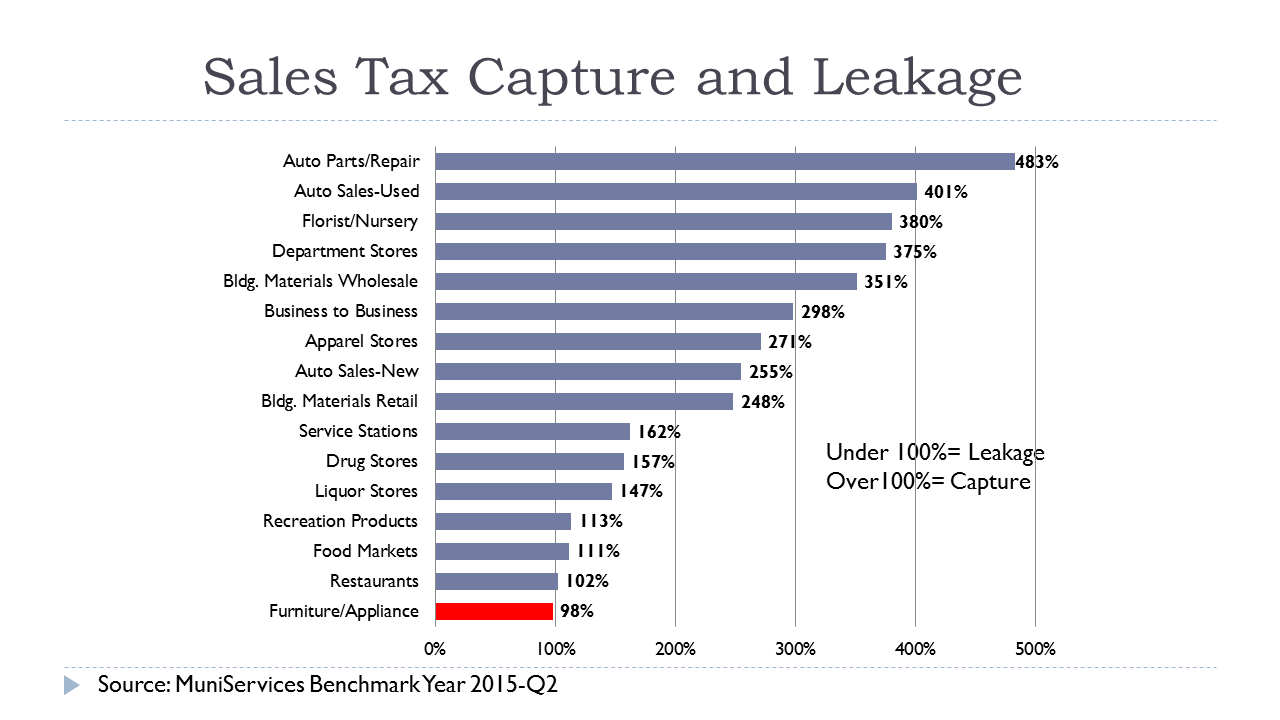
- When sales in a sector exceed the local demand for those goods, they are said to be ‘capturing’ sales from surrounding areas. When sales do not meet local demand, they are said to be ‘leaking’ sales. On the chart above, percentages above 100% show sectors where sales exceed local demand for those goods.
- Sales exceed local demand in all major sectors, except Furniture and Appliances. With the arrival of Living Spaces later this year, sales in this sector are expected to increase.
To read the first part in this series, click HERE.
To read the second part in this series, click HERE.


[…] To read the third part in this series, click HERE. […]
[…] To read the third part in this series, click HERE. […]
[…] retail sector that until now was not meeting local demand for goods (as described in Part 3 of the Economic Development Update published earlier this […]